2013-01-07: The Dawn of a New Year …

.
High Noon for a Festering Planetary Issue … Our Little Planet …
Based on ‘real’ measurements around the world during 2011, the state of Greenhouse Gases (GHG’s) in the Atmosphere is steadily becoming worse … and, following the latest shindig in Doha (UNFCCC – COP 18), the prospect of an effective global agreement on Climate Change Mitigation entering into legal force, anytime soon, is even more remote than ever !
UN WMO Greenhouse Gas Bulletin No.8 – 19 November 2012
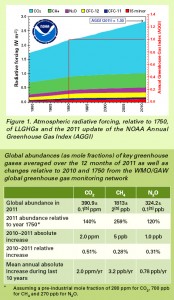
WMO GHG Bulletin No.8 – Executive Summary:
The latest analysis of observations from the WMO Global Atmosphere Watch (GAW) Programme shows that the globally averaged mole fractions of Carbon Dioxide (CO2), Methane (CH4) and Nitrous Oxide (N2O) reached new highs in 2011, with CO2 at 390.9±0.1 parts per million, CH4 at 1813±2 parts per billion, and N2O at 324.2±0.1 parts per billion. These values constitute 140%, 259% and 120% of pre-industrial (before 1750) levels, respectively. The atmospheric increase of CO2 from 2010 to 2011 is similar to the average growth rate over the past 10 years. However, for N2O the increase from 2010 to 2011 is greater than both the one observed from 2009 to 2010 and the average growth rate over the past 10 years. Atmospheric CH4 continued to increase at a similar rate as observed over the last 3 years. The NOAA Annual Greenhouse Gas Index shows that from 1990 to 2011 radiative forcing by Long-Lived Greenhouse Gases (LLGHG’s) increased by 30%, with CO2 accounting for about 80% of this increase.
.
Climate Change Adaptation
Encompasses urgent and immediate actions at local, national, regional and international levels … to reduce the vulnerability and strengthen the resilience of the Human Environment, including ecological and social systems, institutions and economic sectors … to present and future adverse effects of climate change, including variability and extremes, and the impacts of response measure implementation … in order to minimize the local threats to life, human health, livelihoods, food security, assets, amenities, ecosystems and sustainable development.
Climate Change Adaptation is also the most important driving force for Sustainable Human & Social Development.
.
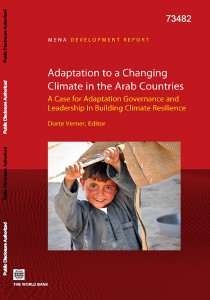
A few weeks ago, The World Bank (International Bank for Reconstruction and Development, based in Washington D.C.) … an Institution which is not at all shy about dishing out harsh medicine to the Developing World … published a report on Climate Change Adaptation in the Middle East and North Africa/ Arab Region.
What I immediately wondered was … how would we, in the Developed World, like a taste of this same medicine … our own medicine … and would we swallow ?!?
The European Commission has still not produced an E.U. Climate Change Adaptation Strategy or Plan.
In Ireland … our National Climate Change Strategy (2007-2012) has just lapsed, with no replacement in sight … and, confirming a lack of both political leadership and institutional capacity … any mention of the word ‘Adaptation’ creates either panic or apathy … depending on the individual, and his/her responsibilities.
.
So … as appropriate, just substitute your own country wherever there is a reference to ‘Arab Region’ or ‘Arab Countries’ in the text below … and see how you feel …
World Bank (IBRD) Report 73482 – 1 December 2012
Adaptation to a Changing Climate in Arab Countries – A Case for Adaptation Governance & Leadership in Building Climate Resilience
.
Selected Extracts from World Bank MENA Report’s OVERVIEW:
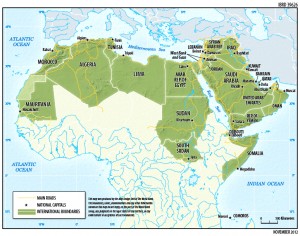
Climate change is happening now in the Arab Countries. The year 2010 was the warmest since the late 1800’s, when this data began to be collected, with 19 countries setting new national temperature highs. Five of these were Arab Countries, including Kuwait, which set a record high of 52.6 °C in 2010, only to be followed by 53.5 °C in 2011. Extreme climate events are widely reported in local media, and a 2009 Arab Region Survey showed that over 90% of the people sampled agree that climate change is occurring and is largely due to human activities; 84% believe it is a serious challenge for their countries; and respondents were evenly split on whether their governments were acting appropriately to address climate change issues. The sample came mostly from the better-educated population, but it shows that there is a firm base and desire for action regarding climate change across the Arab Region.
.
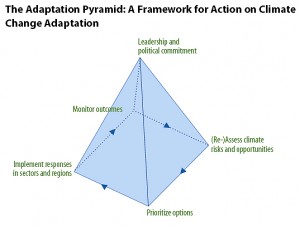
Arab Countries can take action to reduce their vulnerability to climate change. For example, this report proposes an Adaptation Pyramid Framework that assists stakeholders in Arab Countries in integrating climate risks and opportunities into development activities. It is based on an adaptive management approach, but it also highlights the importance of leadership, without which adaptation efforts are unlikely to achieve the necessary commitment to be successful. The Framework begins by assessing climate risks and opportunities and identifying options within the context of other development planning. The next step is to identify and prioritize adaptation options within the context of national, regional, and local priorities. Finally, adaptation responses will be implemented and outcomes monitored over time. It is important to take into account the long-term consequences of these decisions, because short-term responses may not be efficient or could lead to maladaptive outcomes. Other important measures for Arab Region policy makers to implement are discussed below …
.
- Facilitate the development of publicly accessible and reliable information related to climate change. Access to quality weather and climate data is essential for policy-making. Without reliable data on temperature and precipitation levels, it is difficult to assess the current climate and make reliable weather forecasts and climate predictions. For example, information on river flows, groundwater levels, and water quality and salinity is critical for assessing current and future water availability. However, climate stations across most of the Arab Region are very limited compared to most other parts of the world and what data exists is often not digitized or publicly available. Conflict in parts of the region disrupts both the collection and sharing of data. Information on food production and the main food supply chains (such as changes in agricultural yields and production for important crops, forage, and livestock) needs to be linked with weather and water data to better monitor and understand the effects of a changing climate. In addition, socio-economic data (including household and census data) and other economic data related to the labour market and production should be collected and made available.
- Build climate resilience through social protection and other measures. Resilience is determined by factors such as an individual’s age, gender, and health status, or a household’s asset base and degree of integration with the market economy. Underinvestment in social safety nets – public services such as water supply and wastewater treatment, and housing and infrastructure – make people more vulnerable to a changing climate. Further, there should be measures in place to ensure equitable access to health care and a quality education. Such social protection measures include insurance schemes, pensions, access to credit, cash transfer programs, relocation programs, and other forms of social assistance. These investments and instruments facilitate economic and social inclusion, which creates co-benefits between adaptation and development goals.
- Develop a supportive policy and institutional framework for adaptation. Basic conditions for effective development, such as the rule of law, transparency and accountability, participatory decision-making structures, and reliable public service delivery that meets international quality standards are conducive to effective development and adaptation action. In addition, climate change adaptation requires new or revised climate-smart policies and structures at all levels.
Sound adaptation planning, strong governmental/non-governmental co-operation, and plentiful financial resources are all important for building resilience to climate change. Developing national adaptation strategies are important for prioritizing adaptation activities that respond to urgent and immediate needs, and for setting forth guiding principals in the effort to cope with climate change. National governments have a key role in developing these strategies and as a result play an important role in promoting collaboration and co-operation. This co-operation should include the government, civil society, the private sector, and international institutions. Within governments, inter-ministerial co-ordination is especially critical, because adaptation responses often require activities involving multiple ministries and sectors. Finally, to do any of the activities above it is important to secure the necessary financial resources. There are many sources for adaptation funding, but first the Arab Countries will need to build their capacity to analyze their financial needs and generate and manage these resources.
By nature, adaptation to climate change is a dynamic process, and so is the governance of adaptation. Political change, including those changes originating from the Arab Spring, can provide an opportunity to increase civil society participation in adaptation governance and a move toward a more inclusive approach to addressing climate change issues and building climate resilience.
This report is about climate change, its impacts on people, the systems upon which we depend, and how we might adapt to climate change. It highlights a number of issues and areas that are being affected by climate change. One important message of this report is that climate change should be taken into account in all activities – however, this report cannot provide solutions or options for all issues. For example, the transboundary water issues are already being addressed by international task forces; this report can deal only with how climate change might affect their decisions. Anticipation of climate change can be the stimulus for improving interventions and accelerating action, which has been seen in countries such as Australia, where water laws and management were extensively changed in response to a prolonged drought and the anticipation of further climate change issues.
.
.
END
